One Size Fits All?
External shocks and legislative design decisions combust in municipal budget deliberations, giving Councils more credit for undesirable situations than they have control over them because the conflicts preceding budget approval are newsworthy and the final decision about how to respond happens in Council chambers.
Though broadly discrediting to municipal institutions and actors, the sequence unfolds in ways that are more damaging to economically disadvantaged areas and more damning for their municipal leadership.
There’s Only One Ratepayer
When developers don’t cover the cost of the infrastructure required for new development, municipal Councils have two choices for where to make up the difference: Spend less on services, thereby reducing service levels across the board, or spend the same on services by charging more through other revenue streams: Taxes and fees.
1. Who’s Job is Revenue?
Like many municipal functions, revenue mobilization is a shared responsibility, with staff and elected leaders each playing a part.
But which part?
Especially when it comes to the overall revenue strategy and harnessing new revenue streams, we've found that there's room for role definition.
3. Ontario Case Study - 3.1. Provincial Design & Local Response
How does the provincial design of municipal institutions play out in local communities, on Council, and to what end?
The article finds that local responses to weak design contribute to sub-optimal financial results.
Come Clean: Taking a Look at How Far the Provincial Hand is in the Municipal Pocket
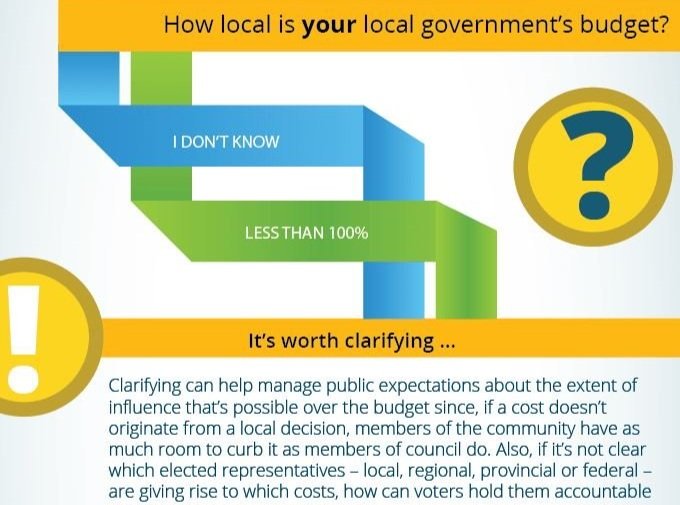
We often hear that local governments in Canada get just 9 cents of every tax dollar. But how much of that is even a council’s to spend?
One study found that just 9% of a municipality’s annual operating spend flowed from council decisions.*
How local is your local government’s budget?
Four Budget Visuals to Help You Tell Your Story
Infrastructure ownership changes and challenges.
Discrepancies between Council’s verbal and financial commitments to capital projects.
Rate-setting and levy presentation refinement.
How to demonstrate the value of municipal services so that residents get an hourly reminder from their own body.
3.2. Changing Authority to Generate Revenue
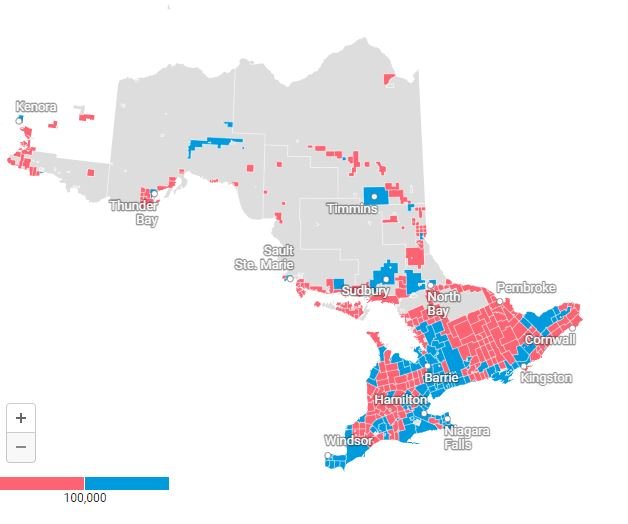
This timeline of changes in local authority to generate revenue, as well as the provincial political parties from which additions and subtractions came, contextualize movements in Ontario municipalities’ actual revenue results, 1990-2020.
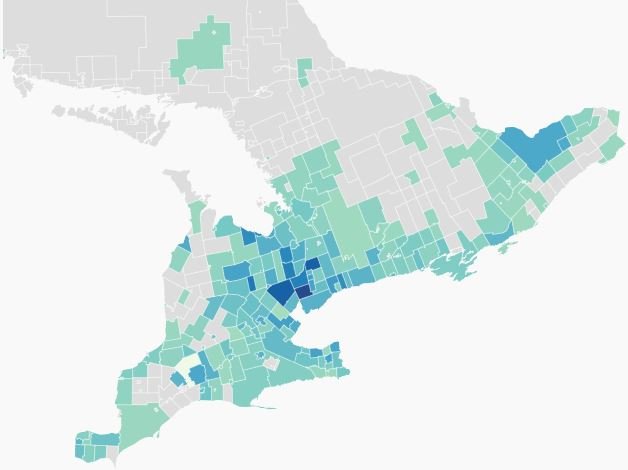
3.3. Charting Revenue Results, 1990-2020
An historical lens on municipalities’ current budget pressures, these tables, charts and animations can help you paint a picture fit for the most digital budget on record.
Municipalities: Resume or Rebuild?
Normal. After health and safety concerns, the most common crisis impulse is to get back to ‘the way it was.’ Including professionally. Let’s distinguish, however between continuing to do something the way you’ve always done it and reverting to it after a break in the status quo.
For treasurers looking to go beyond patching the gaps in policy and procedure exposed by the disruption and re-consider some of the fundamentals whose logic produced the gaps, we have a request for you too: Keep reading.


