
Come Clean: Taking a Look at How Far the Provincial Hand is in the Municipal Pocket
We often hear that local governments in Canada get just 9 cents of every tax dollar. But how much of that is even a council’s to spend?
One study found that just 9% of a municipality’s annual operating spend flowed from council decisions.*
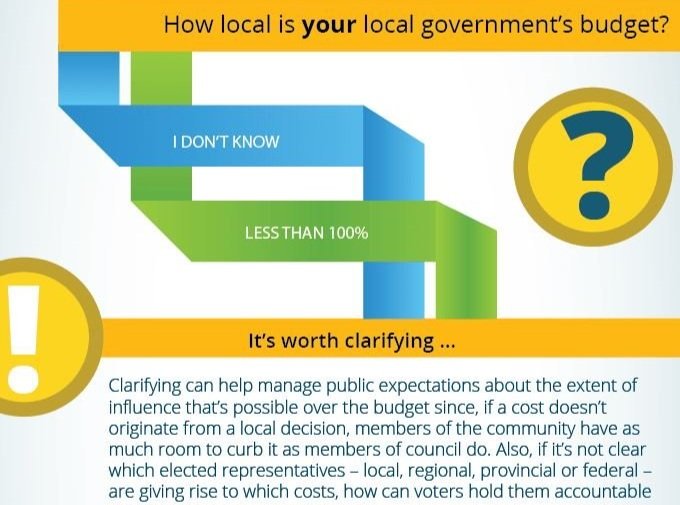
How local is your local government’s budget?

Four Budget Visuals to Help You Tell Your Story
Infrastructure ownership changes and challenges.
Discrepancies between Council’s verbal and financial commitments to capital projects.
Rate-setting and levy presentation refinement.
How to demonstrate the value of municipal services so that residents get an hourly reminder from their own body.